
Another contribution to the series „What to do when there’s a fire😊
An effective & cool way to analyze (among other things) crash dumps is offered by the Microsoft Store App „WinDbg Preview“.
Deep Link to the Microsoft Store:
Get WinDbg Preview – Microsoft Store
A comprehensive technical documentation can be found here:
Debugging Using WinDbg Preview – Windows drivers | Microsoft Docs
If – contrary to expectations – a BSOD (Blue Screen Of Death) should occur, I recommend the following procedure:
Find the dump file, which is either c:\windows\memory.dmp (usually quite large) or c:\windows\minidump\
Annotation:
I recommend the use of the minidumps and only in „hard cases“ the use of the much bigger (!) Memory.dmp, which can be set via „sysdm.cpl“ as follows:
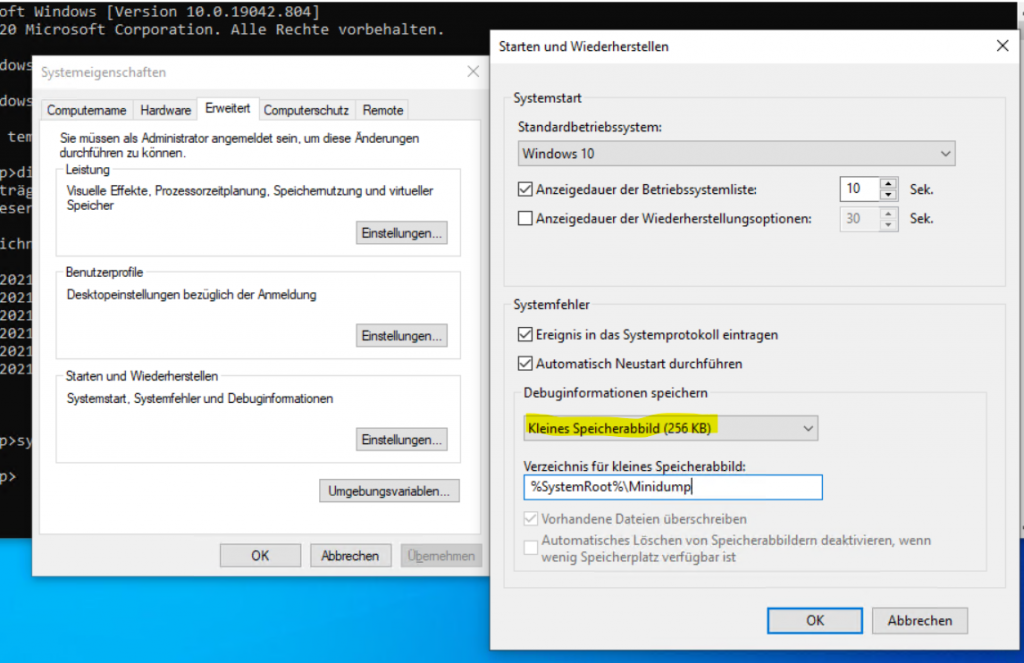
Today’s machines usually have a lot of RAM, so a memory dump is usually not effective.
The so-called „small memory dump“ produces much smaller dumps in the directory C:\Windows\Minidump (with timestamp in the file name).
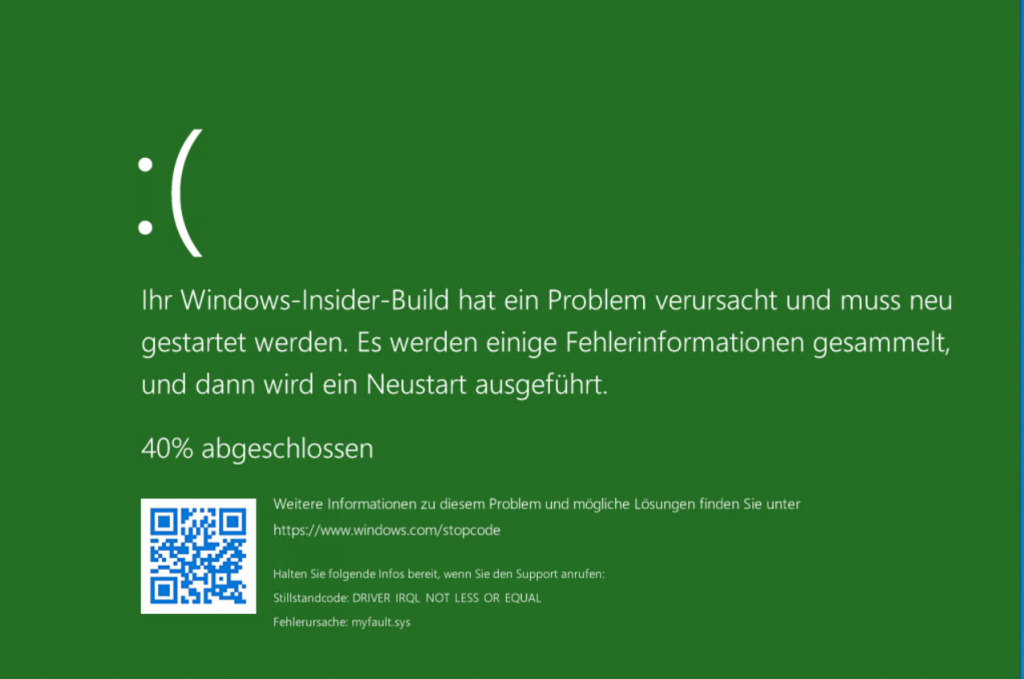
Current BSOD (Insider Developer Build 21343.1000, a german screenshot 😊, in nice GREEN, although this is actually known as BLUE Screen of Death, so they try to calm down the user seeing this with „everything is not so bad“, „green“, „keep calm“ 😊)
I „provoked“ this BSOD with the SysInternals utility „NotMyFault“ from SysInternals (see below) 😊
The QR code in it is „less helpful“ and should rather to be regarded as a „gag“, nevertheless the relevant information about the „root cause“ of the crash is already in there (here it is the driver „myfault.sys“), which is why a cell phone photo at exactly this time is recommended 😊
At this point, I would like to refer you to my article „What to do when there’s a fire“ 😊
What to do when there’s a fire? – Microsoft Windows Deployment Guru Blog EN
After starting the WinDbg PreView app, select „Open dump file“ from the main menu:
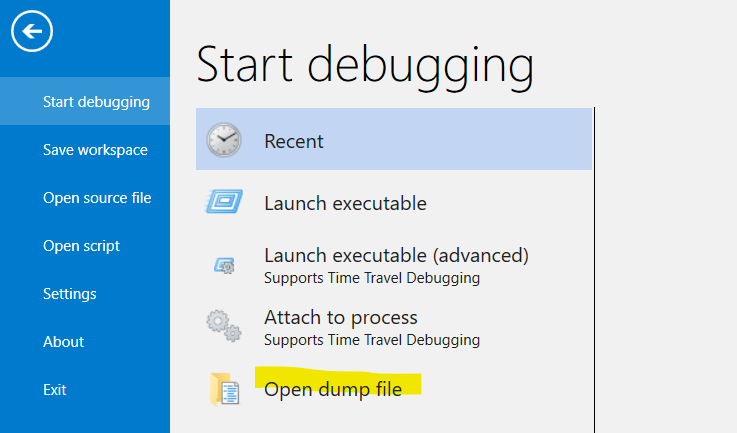
There load the corresponding .dmp file and wait a bit
Annotation:
A fast Internet connection is very helpful here, because the so-called „symbols“ of the MSFT binaries are also attracted via it.
Then do exactly what it says in the debug window, namely „!analyze -v“.
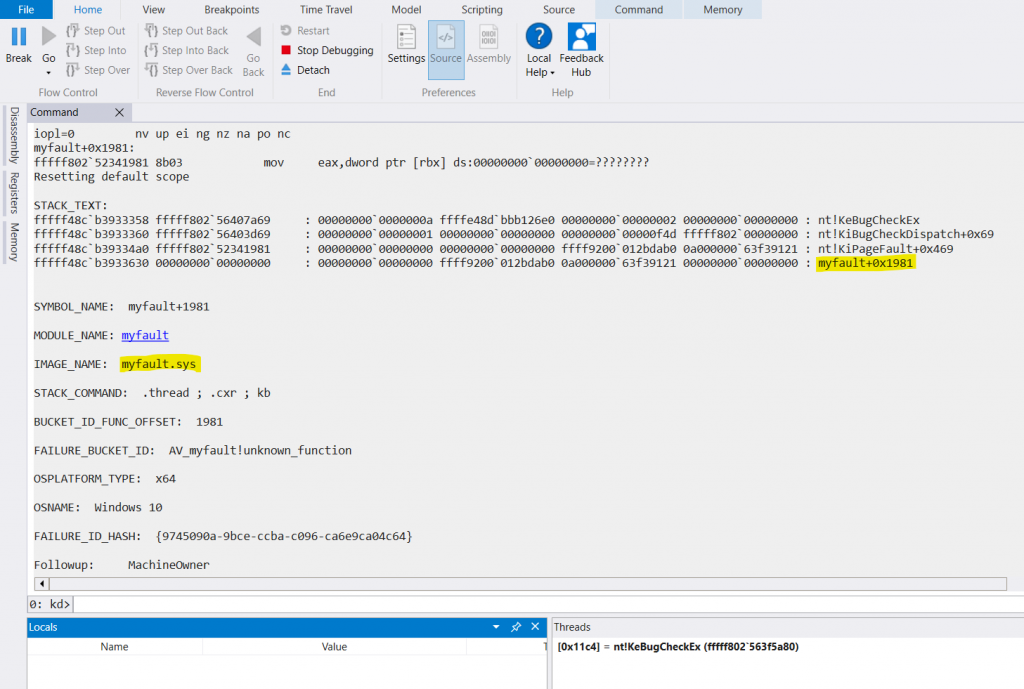
Result of „!analyze -v“, important here: everything NOT starting with „nt!“ is a potential „culprit“, because all „nt!“. things are functions of Windows Kernel dll’s & which are usually stable (meanwhile actually!).
In other words: usually 3rd party apps & binaries & drivers are „to blame“ 😊
Tip:
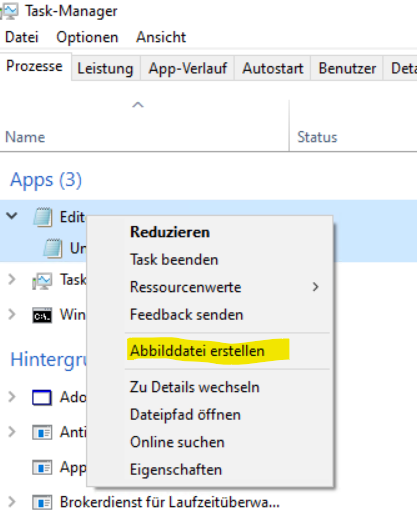
You can also create dump files with the (builtin) TaskManager.
This is often used when an app or EXE „eats“ an extremely large amount of CPU or „hangs“:
More recommended community tools on the topic
BlueScreenView (by Nir Sofer)
Blue screen of death (STOP error) information in dump files. (nirsoft.net)
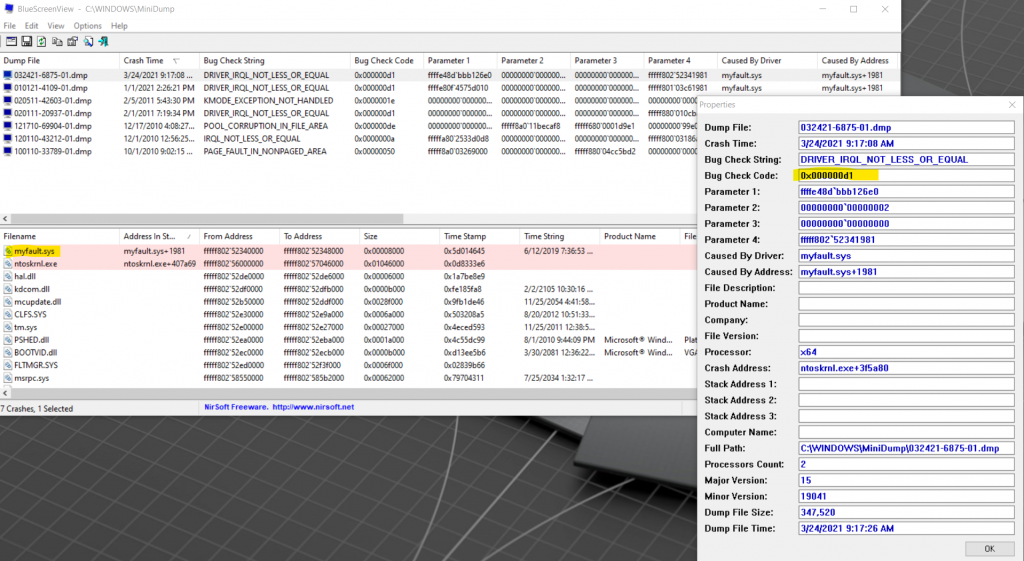
The part taps the folder c:\windows\minidump by default, but this can also be set.
The tool has a number of options, but the simplest is first of all the double-click on a crash entry, which says virtually „everything😊
Here the above example, per notmyfault „provoked“ driver crash 😊
AppCrashView (by Nir Sofer)
AppCrashView – View application crashes (.wer files) in Windows 7/Vista (nirsoft.net)
The tool taps into the Windows Error Reporting (WER), formerly – or for the insiders here – also known as „Dr. Watson Engine“ 😊
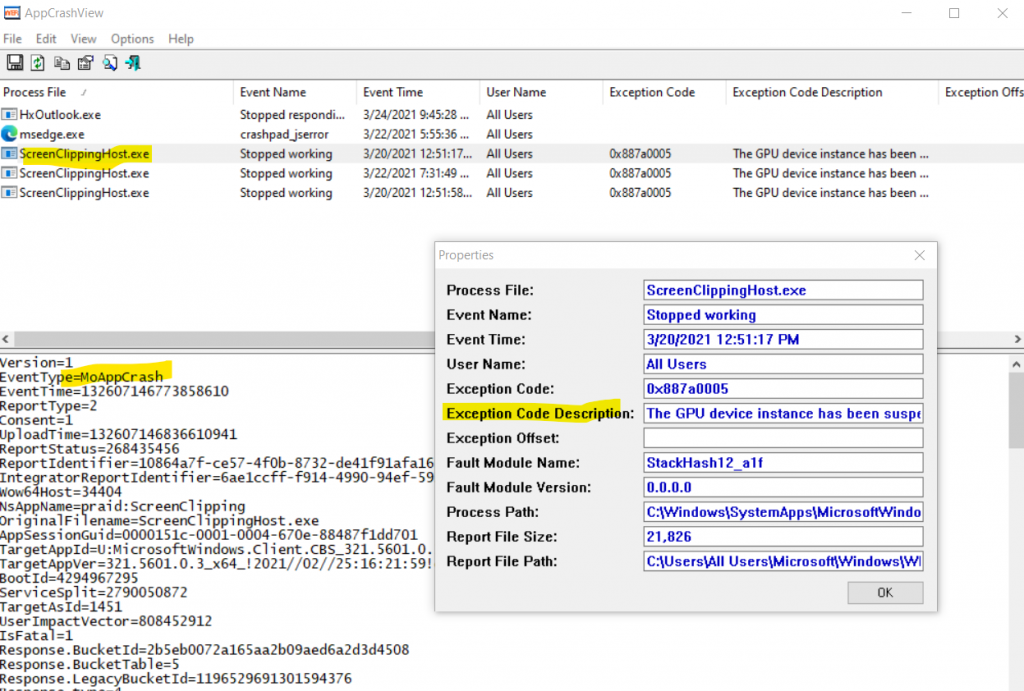
Current example from my W10 Insider Dev Preview client, where (unfortunately) the „Snip&Sketch“ tool (BuiltIn App) is crashing very often ☹
Important Notice:
Several of Nir Sofer’s tools are reported as Trojans by 3rd party virus scanners with „false positives“ because they rarely appear in the wild (also known as „Potentially Unwanted Software“).
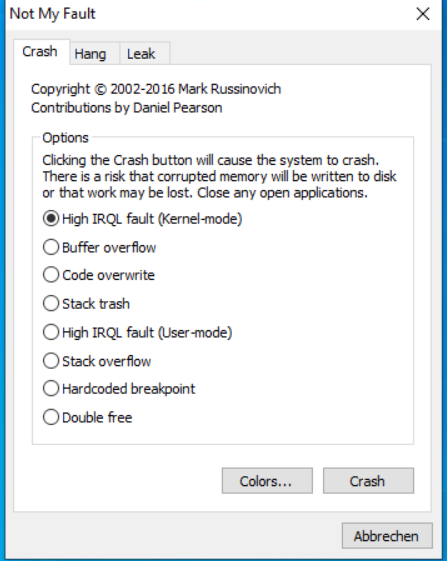
NotMyFault (from SysInternals)
The tool can be used (for practice purposes!) to force crashes of all kinds.
ATTENTION: NEVER do that on your own PRODUCTIVE machine!
NotMyFault – Windows Sysinternals | Microsoft Docs
Tip:
A rarely used & quite unknown (because undocumented) tool is the „Reliability Monitor“, which can be called via CMD as follows:
perfmon /rel
This provides the following informative image with many additional functions, incl. export of the whole thing into a „fancy“ HTML file 😊
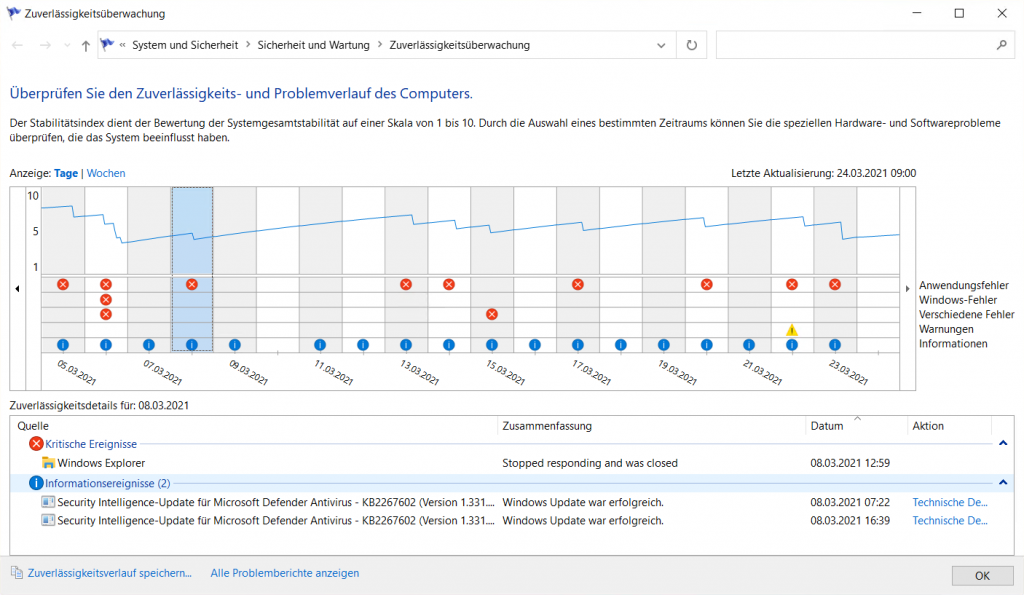
Here you have to experiment a little bit by yourself & have to click the differennt icons and options, the thing speaks for itself and tells you almost everything 😊
HAPPY DEBUGGING!
PS.:
More posts on similarly cool troubleshooting tools & procedures to follow 😊